Data Validation - Currently Enrolled Students
Validate Schedule for Upcoming Year Data
To access your data report, click on Open Summary Report in the Manage Data App under Currently enrolled students - Academic Year 202X - 202X
To properly validate your data, please use the questions written below in blue as a checklist. If you answer "No" to any of the questions, this may mean that the data provided is incomplete/incorrect.
Flagging Inaccuracies
If you do notice any inaccuracies within the report, you can flag the section with a comment. Hover over the section you wish to leave a comment for and click the flag icon. This will allow you to type a comment that the support team can review during their QA process of the data. Please note, once you upload new data, the flagged comment will disappear so be sure to add it in again if the issue is still not resolved with a new set of data.
.gif?inst-v=b963e511-f3aa-44ac-a82f-06347d0f9899)
Please refer to the file specifications provided by Abl support to ensure that the correct and completed data is provided.
If the data is not what you expect to see, DO NOT sign off on the data as it should accurately reflect your SIS.
Quick Stats
This will show the total number of active students, total active students broken down by grade, total active courses, and total active staff. These stats are also broken down by schools in your district that are using the VisAbl Scheduler.
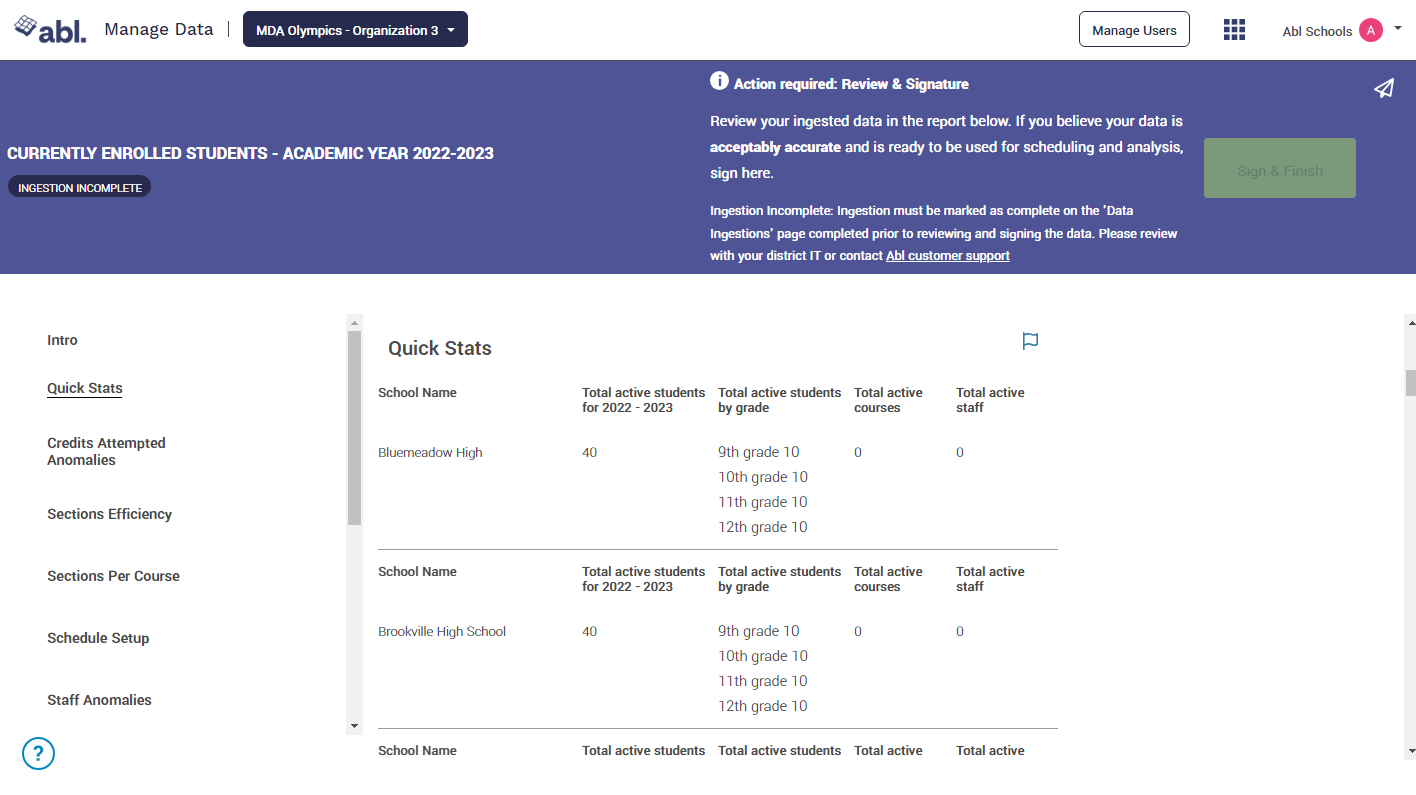
Are all active students (by grade), staff, and courses accurate for all participating schools?
(Returning customers only) - Is there a noticeable shift in the number of students, staff and, courses between the years?
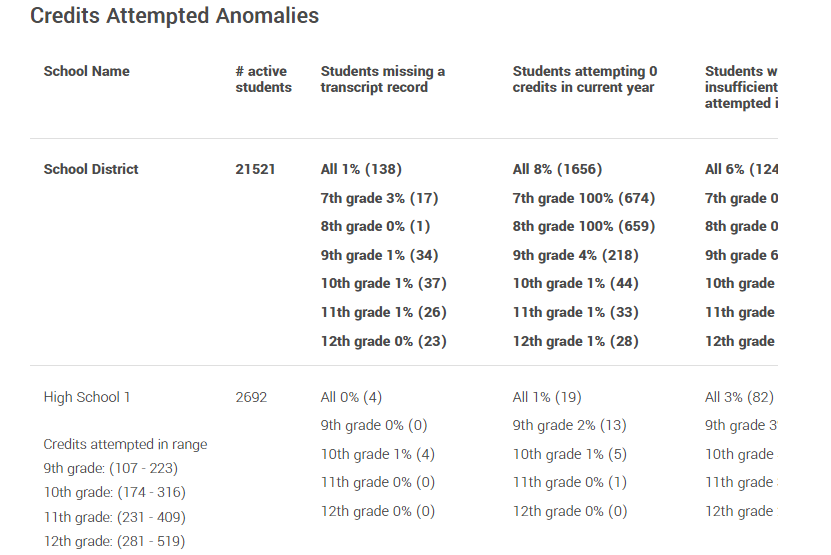
Do all active students have a sufficient amount of cumulative credits attempted and earned given their current grade level?
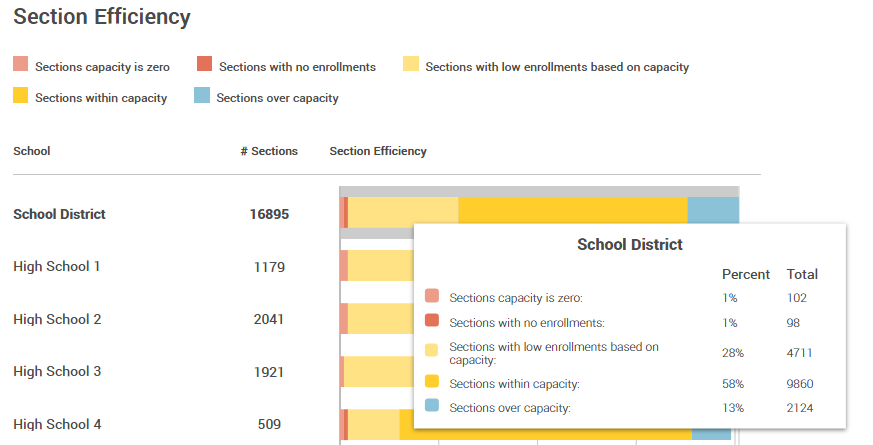
Are the sections offered at a capacity and efficiency expected for each school?
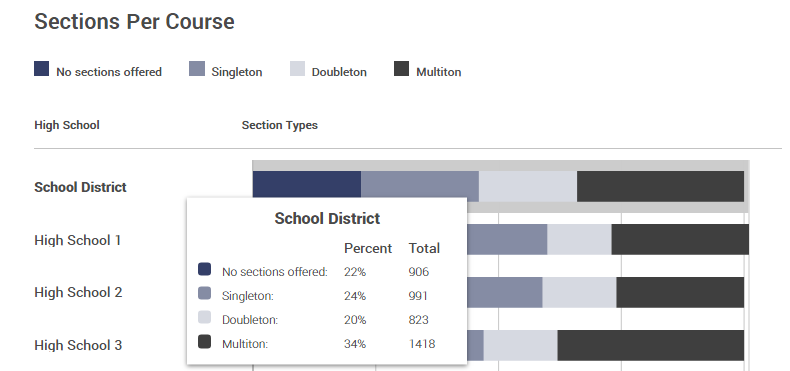
Is there a reasonable number of sections per course? → add distribution of sections per course so that I can tell if it looks like I have too many singletons or multitons.
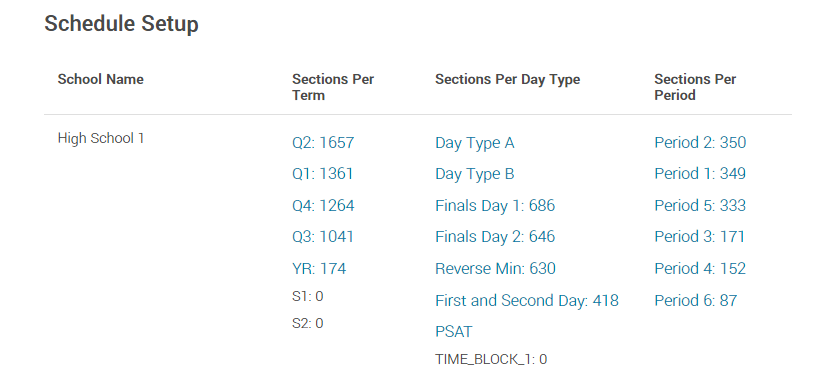
Do the sections per Term, Day Type and, Period seem accurate or are there any anomalies within this data?
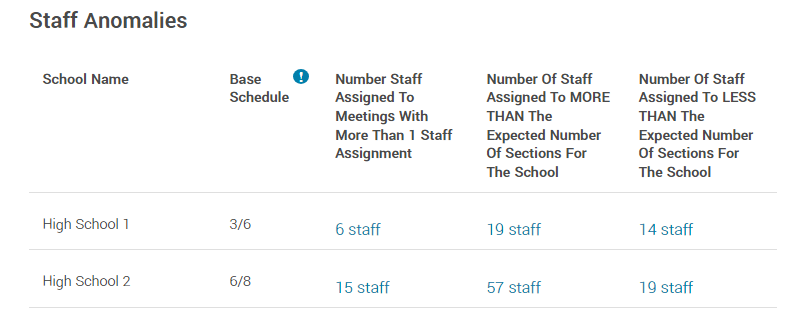
Are teachers teaching the expected number of sections?
Is there a reasonable number of staff participants per meeting? → look at the distribution
Student Demographics
The next thing we will check is the student demographics, this includes race, ethnicity, gender, English language learners, students with disabilities, and students in the FRL program.
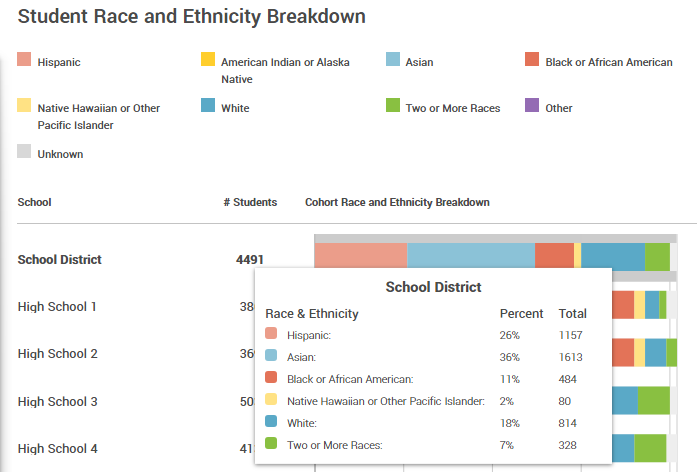
Are the percentages of the student's race and ethnicity for your district and school accurate?
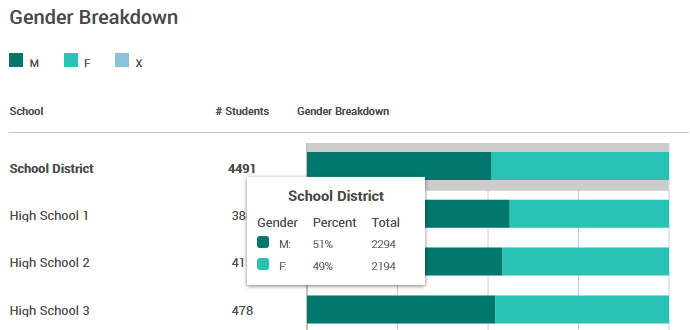
Are the percentages of male and female students for your district and school accurate?
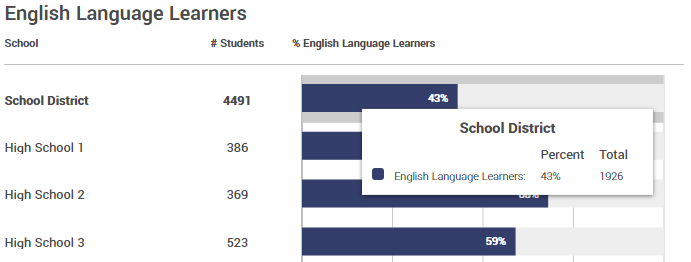
Are the percentages for English Language Learners for your district and school accurate?
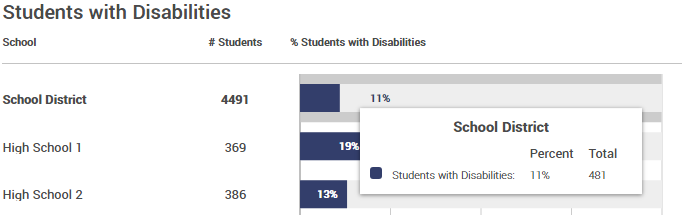
Are the percentage of students with IEPs for both district and school accurate?
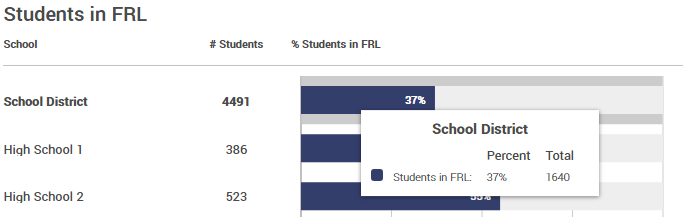
FRL data is not always provided, but if it was provided, do the percentages match your district and school?
Terms
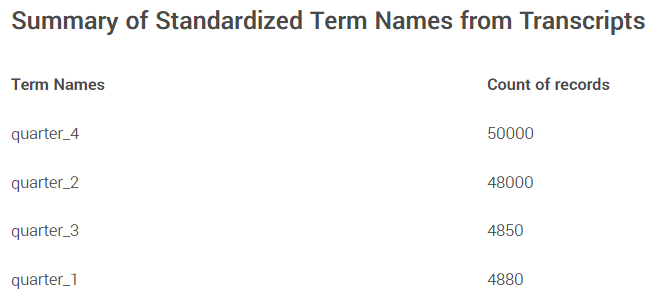
Are the term names appropriate for your district? For example, is it named quarter_4 but your district uses Are any of the terms missing that should be there?
Confirming Data Accuracy
Once you have verified all the data within the report, be sure to click the "Sign & Finish" button at the top of the page. This will inform your support team that you have validated the data within the report and your district is ready for professional development with Abl.
.gif?inst-v=b963e511-f3aa-44ac-a82f-06347d0f9899)