Data Validation - Graduated Cohort
Validate Graduated Cohort Data
To access your data report, click on Open Summary Report in the Manage Data App underGraduated cohort analysis - Class of 202X
.gif?inst-v=b963e511-f3aa-44ac-a82f-06347d0f9899)
To properly validate your data, please use the questions written below in blue as a checklist. If you answer "No" to any of the questions, this may mean that the data provided is incomplete/incorrect.
Flagging Inaccuracies
If you do notice any inaccuracies within the report, you can flag the section with a comment. Hover over the section you wish to leave a comment for and click the flag icon. This will allow you to type a comment that the support team can review during their QA process of the data. Please note, once you upload new data, the flagged comment will disappear so be sure to add it in again if the issue is still not resolved with a new set of data.
.gif?inst-v=b963e511-f3aa-44ac-a82f-06347d0f9899)
Please refer to the file specifications provided by Abl support to ensure that the correct and completed data is provided.
If the data is not what you expect to see, DO NOT sign off on the data as it should accurately reflect your SIS.
Summary of Exit Categories
Here you will see the graduation rate for your district and each school individually. Please keep in mind, these are for your graduating class of the previous year. Example - If we are in the year 2023, we are analyzing the graduating class of 2022.
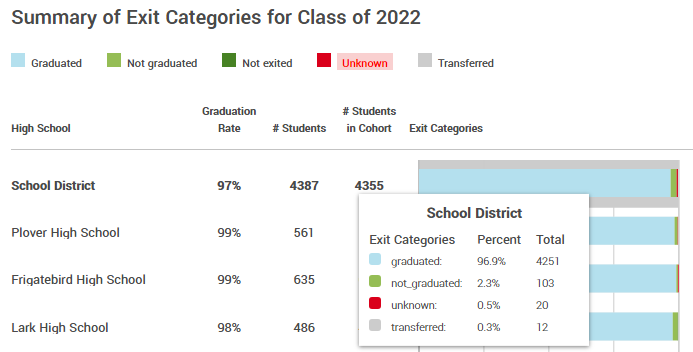
For this section, you want to confirm the # of Students (the students who have graduated, not graduated, transferred, and unknown) in total and the # of Students in Cohort (the students who have either graduated or not graduated).
Are the percentages of students graduating and not graduating accurate for the # Students in Cohort?
Are the total number of Students and the Graduation Rate percentage matching your school/district?
Student Demographics
The next thing we will check is the student demographics, this includes race, ethnicity, gender, English language learners, students with disabilities, and students who qualify for Free and Reduced Lunch (FRL).
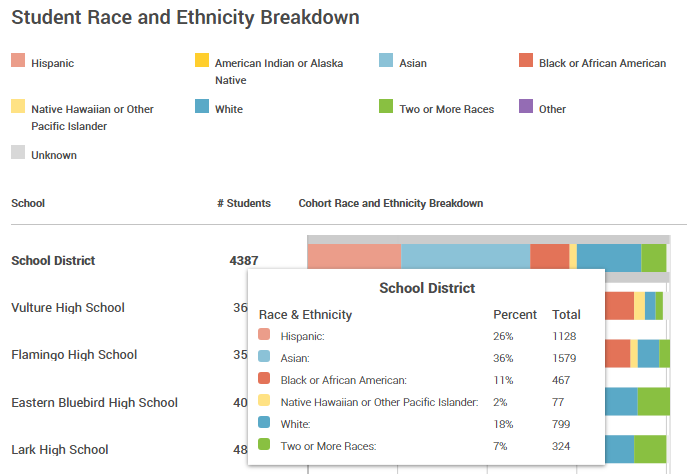
Are the percentages of the student's race and ethnicity for your district and school accurate?
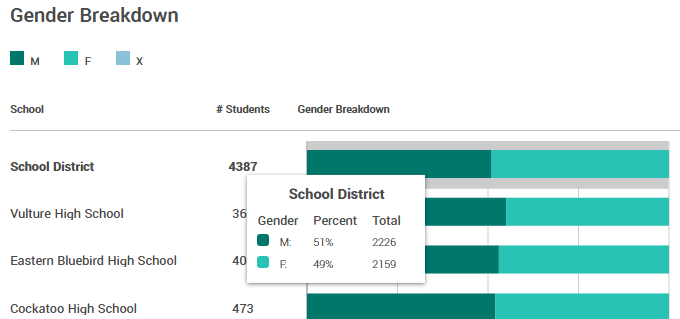
Are the percentages of male and female students for your district and school accurate?
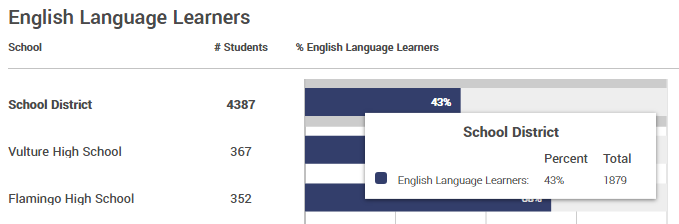
Are the percentages for English Language Learners for your district and school accurate?
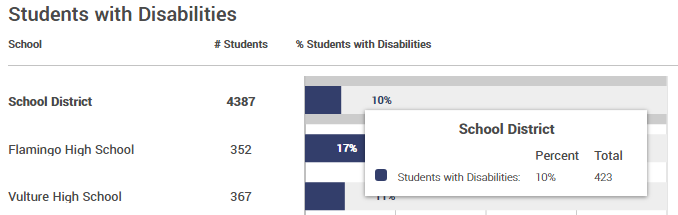
Are the percentage of students with IEPs for both district and school accurate?
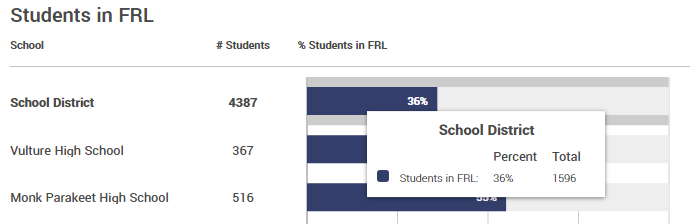
FRL data is not always provided, but if it was provided, do the percentages match your district and school?
Transcript Data
For our analysis, 18 credits is the minimum a student needs to earn. There are a couple of things we want to look for in this section.
The first set of Credit Distribution data will display the percentage of students with a transcript record, the students who have attempted more than 0 credits, and students who have attempted more than 18 credits (our threshold required for analysis).
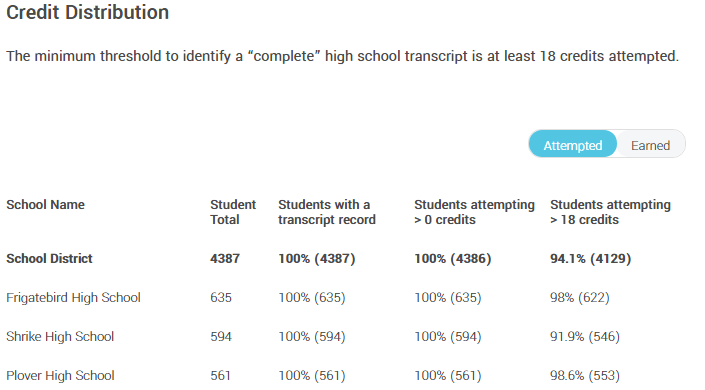
Are any of these values significantly lower than 100%? (<80%)
The second set of Credit Distribution data we will look at is the credits earned by High School. The dotted line represents the minimum number of credits required for Abl to analyze your school's data. If there are a large number of students below the 18 threshold, please check your uploaded files to ensure you have provided completed data.
If the data you see does not look correct, you can click on one of the bars in the graph to investigate further by viewing individual student transcripts. This will show the student's transcript from middle school until grade 12. This will allow you to troubleshoot the issue you are seeing within the bar graph of the credit distribution.
.gif?inst-v=b963e511-f3aa-44ac-a82f-06347d0f9899)
Is the distribution of credits reasonable?
Is it spread out in a way that makes sense for your school?
Do most students fall above the 18-credit threshold?
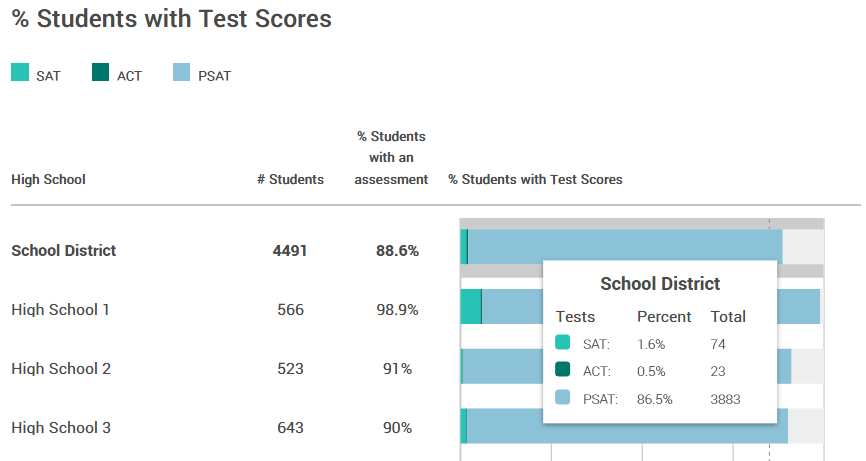
Not all districts provide test scores as they are not necessary for EOA but if they were provided, the data should be checked.
Are all the test scores for SAT, ACT, and PSAT provided? If not, is this data your district would normally provide or are only some of them provided?
Is the % of students with assessments correct?
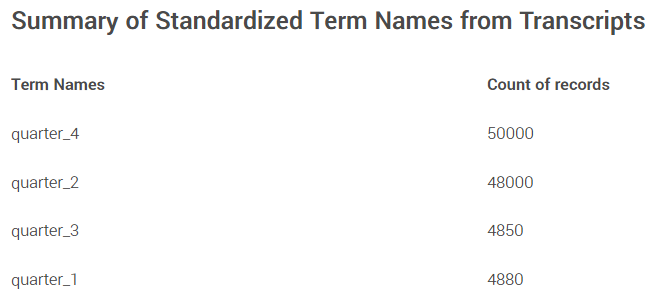
Finally, we need to confirm the terms that were provided in the transcript.
Do the term names reflect the types of terms you use in your district?
Are any of the terms missing that should be there?
Data Sign Off
Once you have verified all the data within the report, be sure to click the "Sign & Finish" button at the top of the page. This will inform your support team that you have validated the data within the report and your district is ready for professional development with Abl.
.gif?inst-v=b963e511-f3aa-44ac-a82f-06347d0f9899)