Schedule Monitoring Report - Action Plan Tracker
How to access the feature [Limited Beta Release]
If this feature is enabled for your school, it will be available in the Abl Analytics app.
To activate the feature, you will need to select an area of in the Action Plan - If you do not select an area of focus you will not see them in the Action Plan Tracker on the Schedule Monitoring reports page.
Login to Abl Analytics
Go to the second tab labeled "Action Plan"
Select your schools area of focus or persistence by subject
Go to the third tab labeled "Schedule Monitoring Report" - you will see the Advanced Coursetaking in X subject and below that you will see Persistence in X subject.
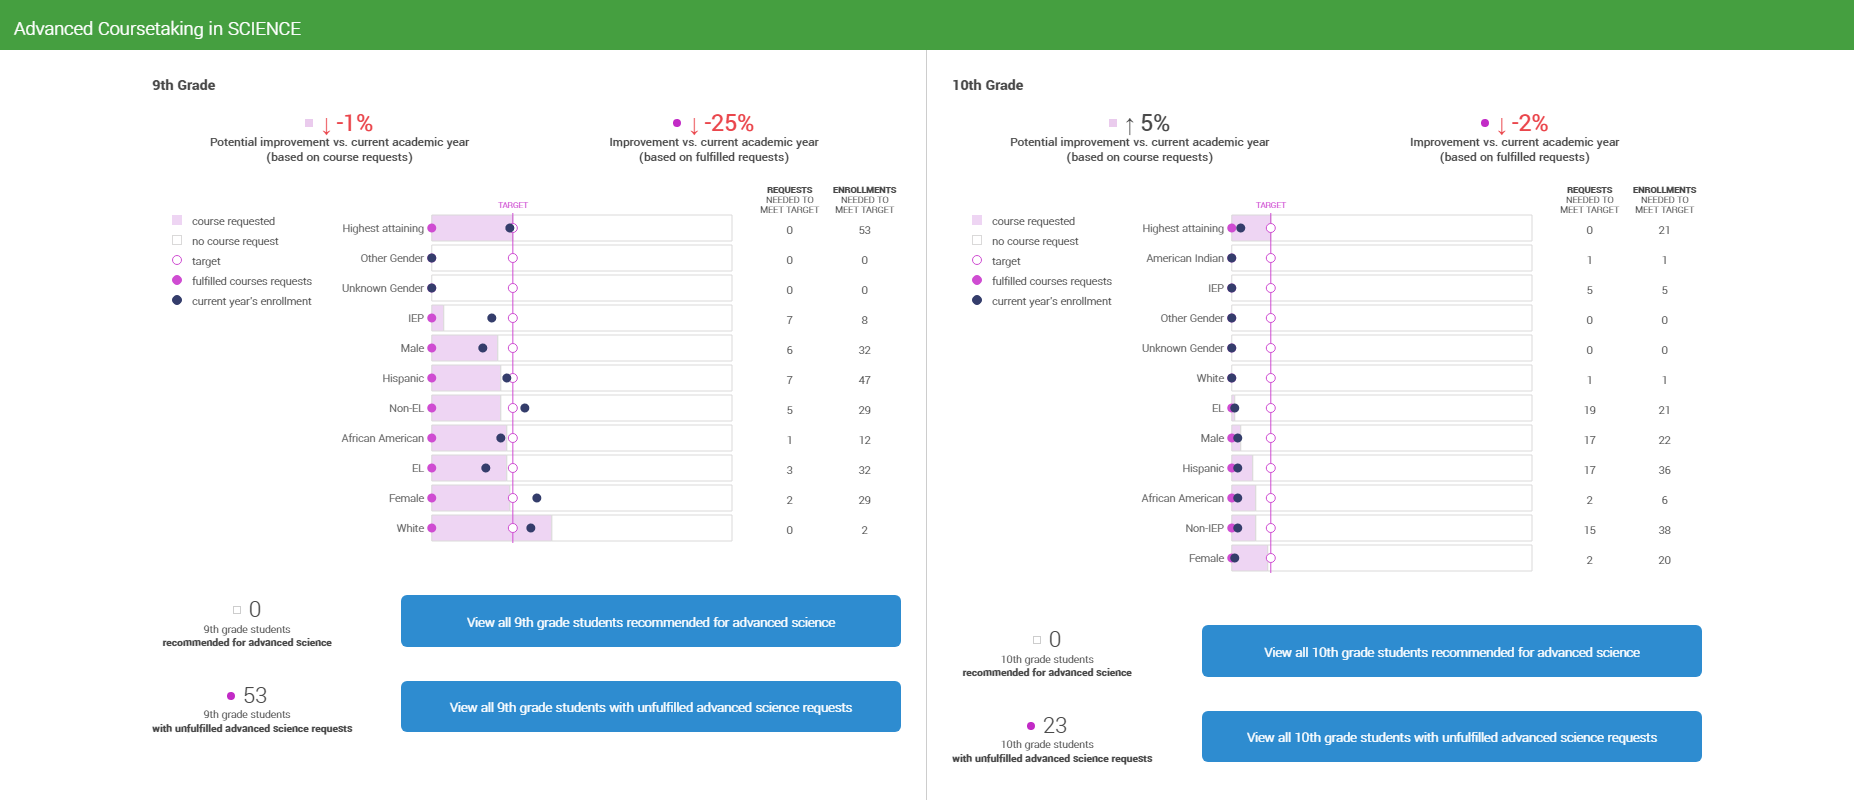
Advanced Coursetaking in [subject area]
If your school has selected an “advanced coursetaking” area of focus, then Abl Analytics will show this section for each subject area that was chosen.
There will be a section for each grade level for which there is at least 1 corresponding course request (eg. if there are 0 advanced math course requests for 9th graders, then we will not show a 9th grade analysis. If there is 1 or more advanced math requests for 10th graders, then we will show the analysis).
Persistence in [subject area]
If your school has selected an “persistence” area of focus, then we will show this section for each subject area that was chosen.
There will be a section for each grade level for which there is at least 1 corresponding course request (eg. if there are 0 course requests for 9th graders, then we will not show a 9th grade analysis. If there is 1 [Abl subject area] requests for 10th graders, then we will show the analysis).
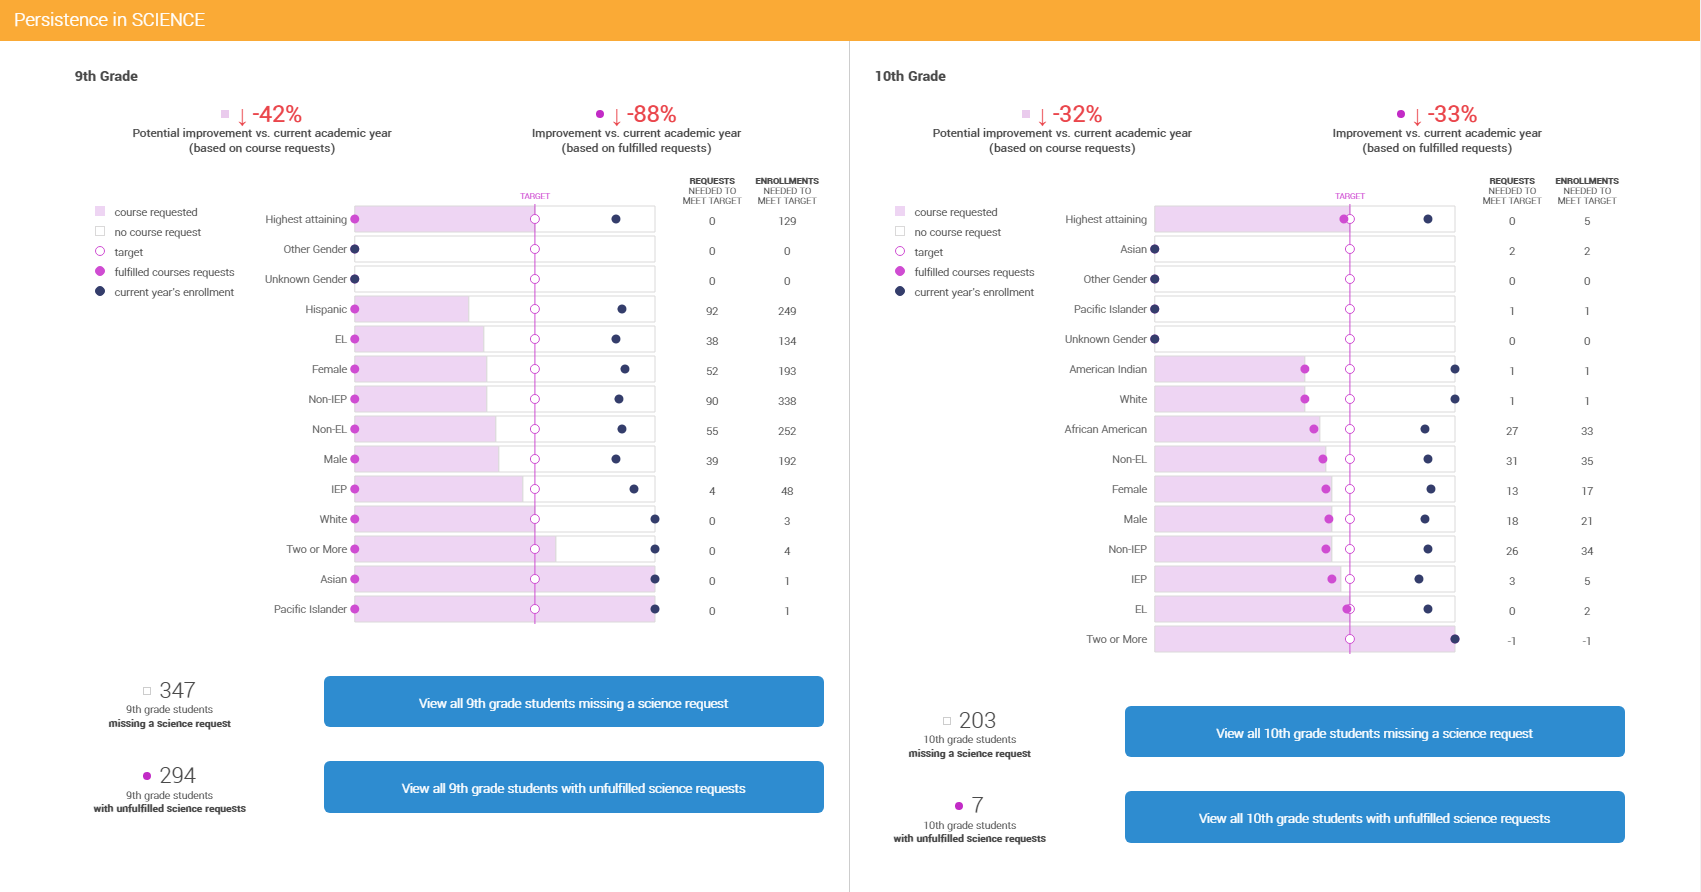
Definitions of Legend Items
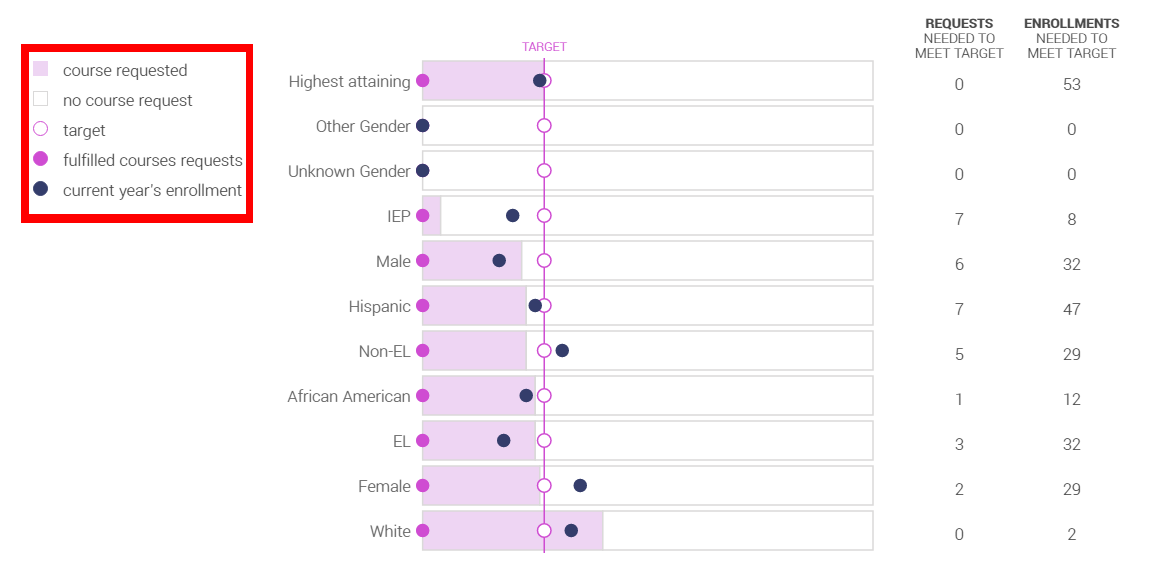
Course requested: The pink bar shows the percentage of students with course requests for the area of focus. This will not be a static value as it is based on the student group with the highest attainment of enrollment in advanced subject area.
No course request: If there is no pink bar, then that indicates that there are no course request for that area of focus in relation to that specific group
Target: The pink outlined dot illustrates the course request target which is based on whichever student group has the highest percentage of course requests for the area of focus.
Fulfilled course requests: The solid pink dot shows how many students have an enrollment in the area of focus for the upcoming school year.
Current year's enrollment: This blue dot shows how many students are enrolled in the current academic year
Target
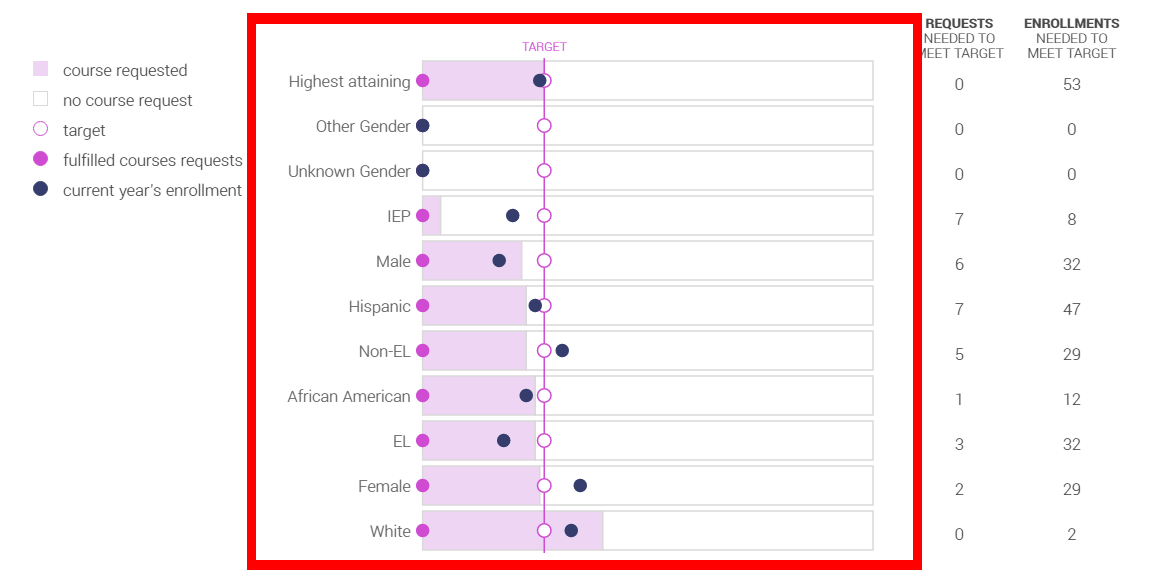
The top row will always show the student group with the highest percentage of course requests for that area of focus. The target for other student groups equals the percentage of the highest attaining student group.
The highest attaining group and the target are fluid and will change as course requests come in.
If a student group is fewer than 10 students, they will never be shown as the highest attaining group.
Requests Needed to Meet Target and Enrollments Needed to Meet Target
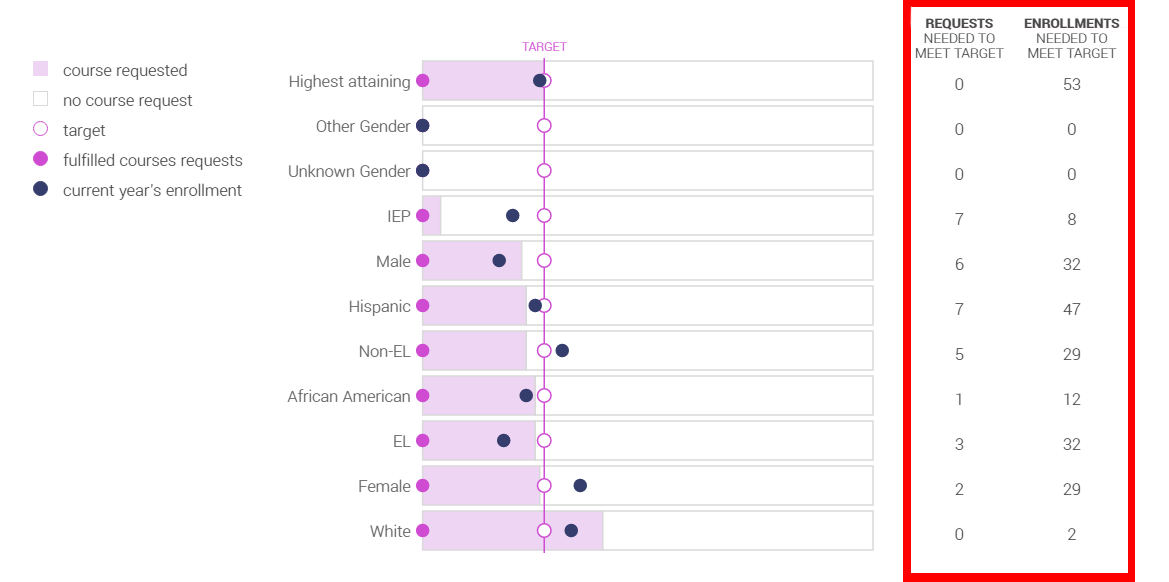
While the bar graphs show you percentages of courses requests and enrollments for student groups, these two columns show you the exact number of students needed to meet the target.
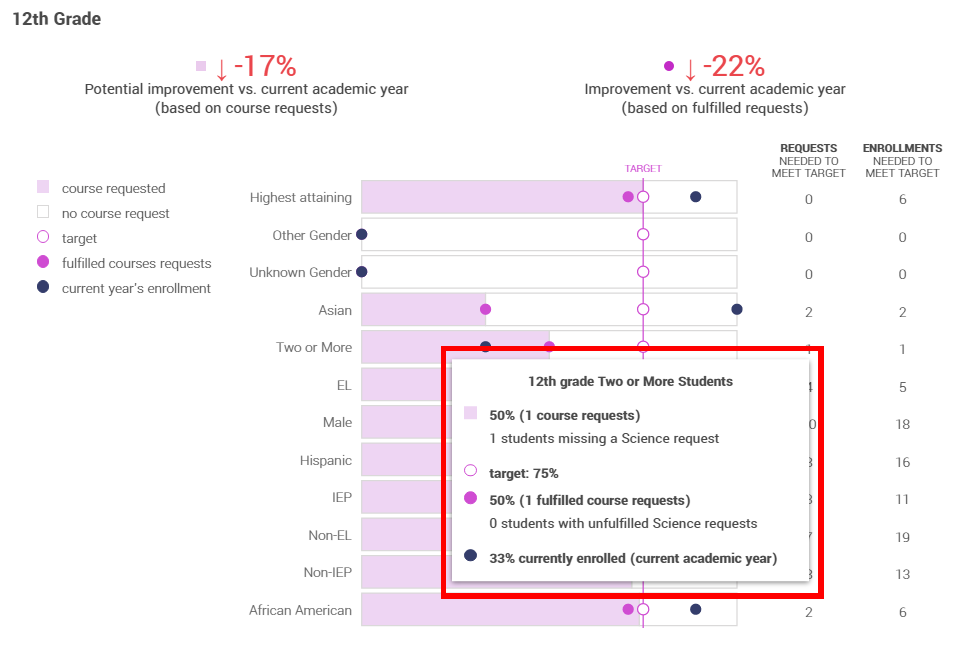
Hover Action
You can hover over a student group to see detailed information for that specific group.
This includes the % and amount of for each of the legend items
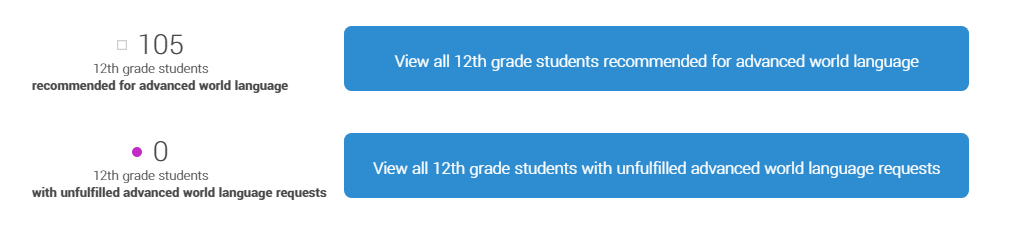
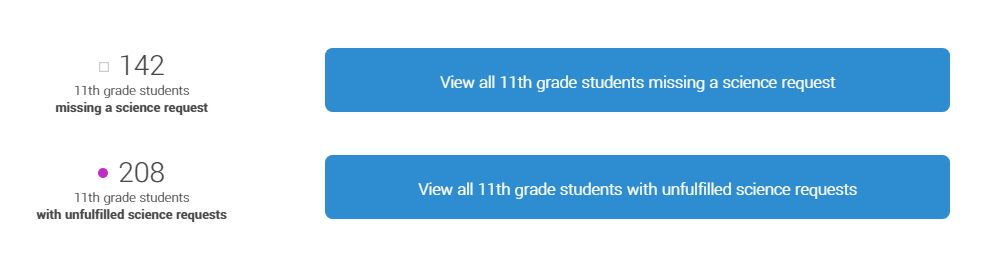
Targeted Student Lists
At the bottom of each grade level users can see how many students are recommended for an advanced course (advanced coursetaking areas of focus) or are missing a request entirely (persistence areas of focus).
Clicking on any of these buttons should open up a new tab and bring up the Abl Scheduler with a filtered list for the button you selected.
For example, if you click on "View all 12th grade students recommended for advanced world language" as shown in the image below, a new tab will open and display the Abl Scheduler with the filter for 12th grade students and advanced course recommendations for world language.
Advanced Coursetaking
Persistence
*Note: Abl does not have advanced course recommendations for 9th and 10th graders so the numbers to the side of the buttons will instead show "[number] students missing advanced requests" for those grade levels.
If users are not beta testers of advanced course recommendations, these targeted lists show students without any requests in that subject area.
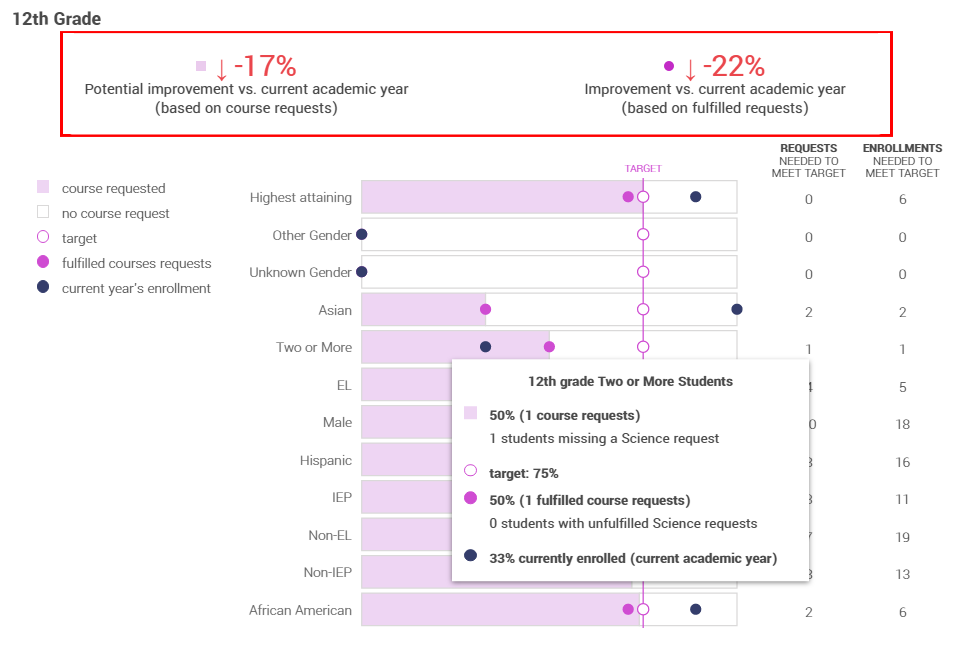
Potential Improvements vs Current Academic Year
(Next year course requests vs. current year enrollments)
This measurement will show the difference between the course requests for the upcoming school year and the enrollments for the current school year. This will give you an idea of the potential for improvements that you can make with your scheduling.
Example: In the image below it is showing -17% Potential improvement vs current academic year. This means that based on the course requests you've received for next years students, it is 17% less than the current enrollments you already have for that subject area and grade level.
Improvement vs Current Academic Year
(Next year enrollments vs. current year enrollments)
This measurement will show the difference between course enrollments for the upcoming school year and course enrollments for the current school year.
Example: In the image below it is showing -22% Improvement vs. current academic year. This means that based on the requests you have already fulfilled, there are 22% less fulfilled requests for the upcoming year than are currently enrolled for that subject area and grade level.