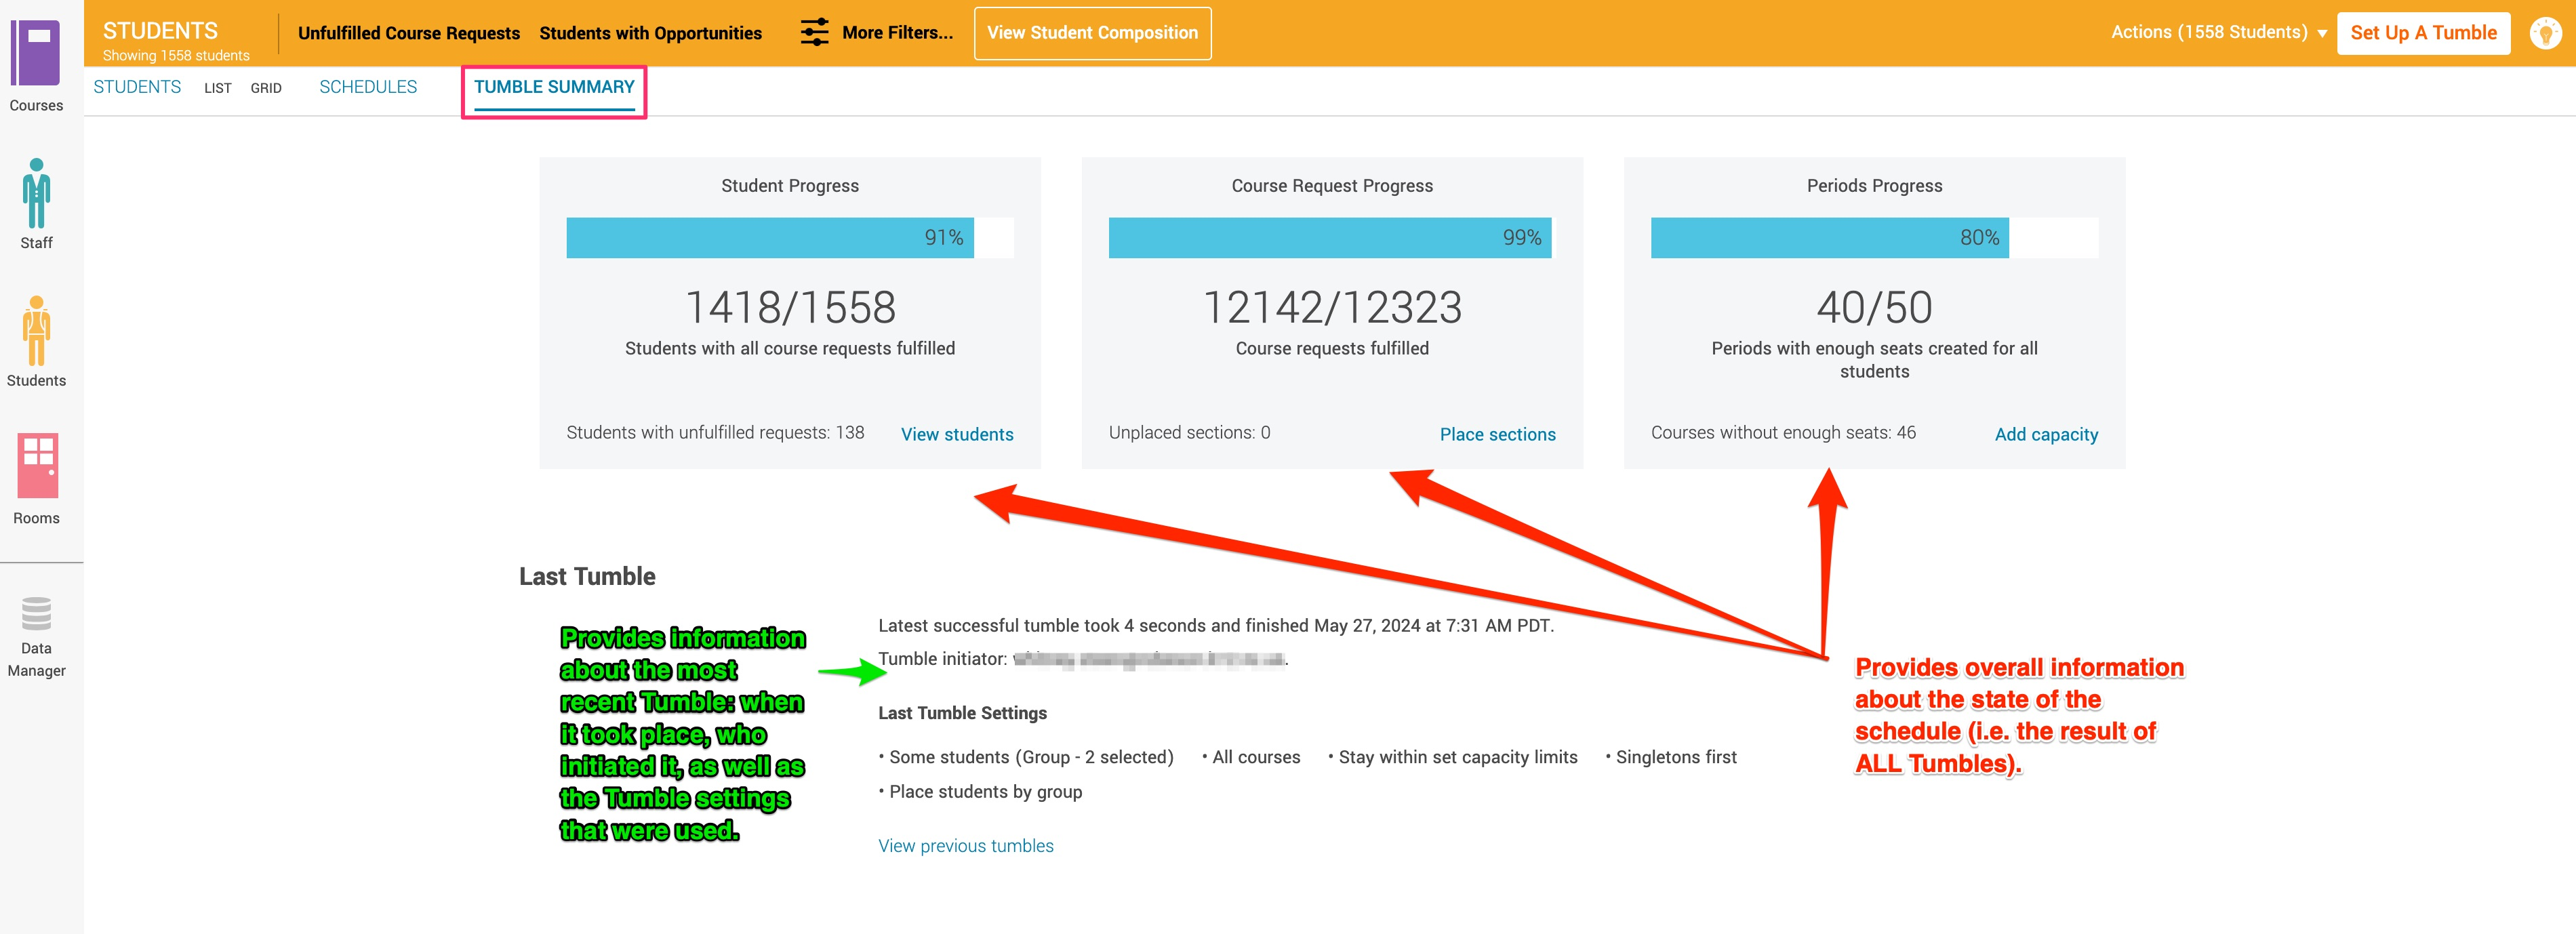
Tumble Summary
When a Tumble completes, you will be shown a post-Tumble summary report that will help identify courses where requests are not being satisfied. Then move to the Students and Staff boards to identify opportunities to move section placements to increase request satisfaction.
The Last Tumble Summary will open automatically at the conclusion of a Tumble. It is also accessible from the Students Board in the header bar. The Tumble Summary contains the following information:
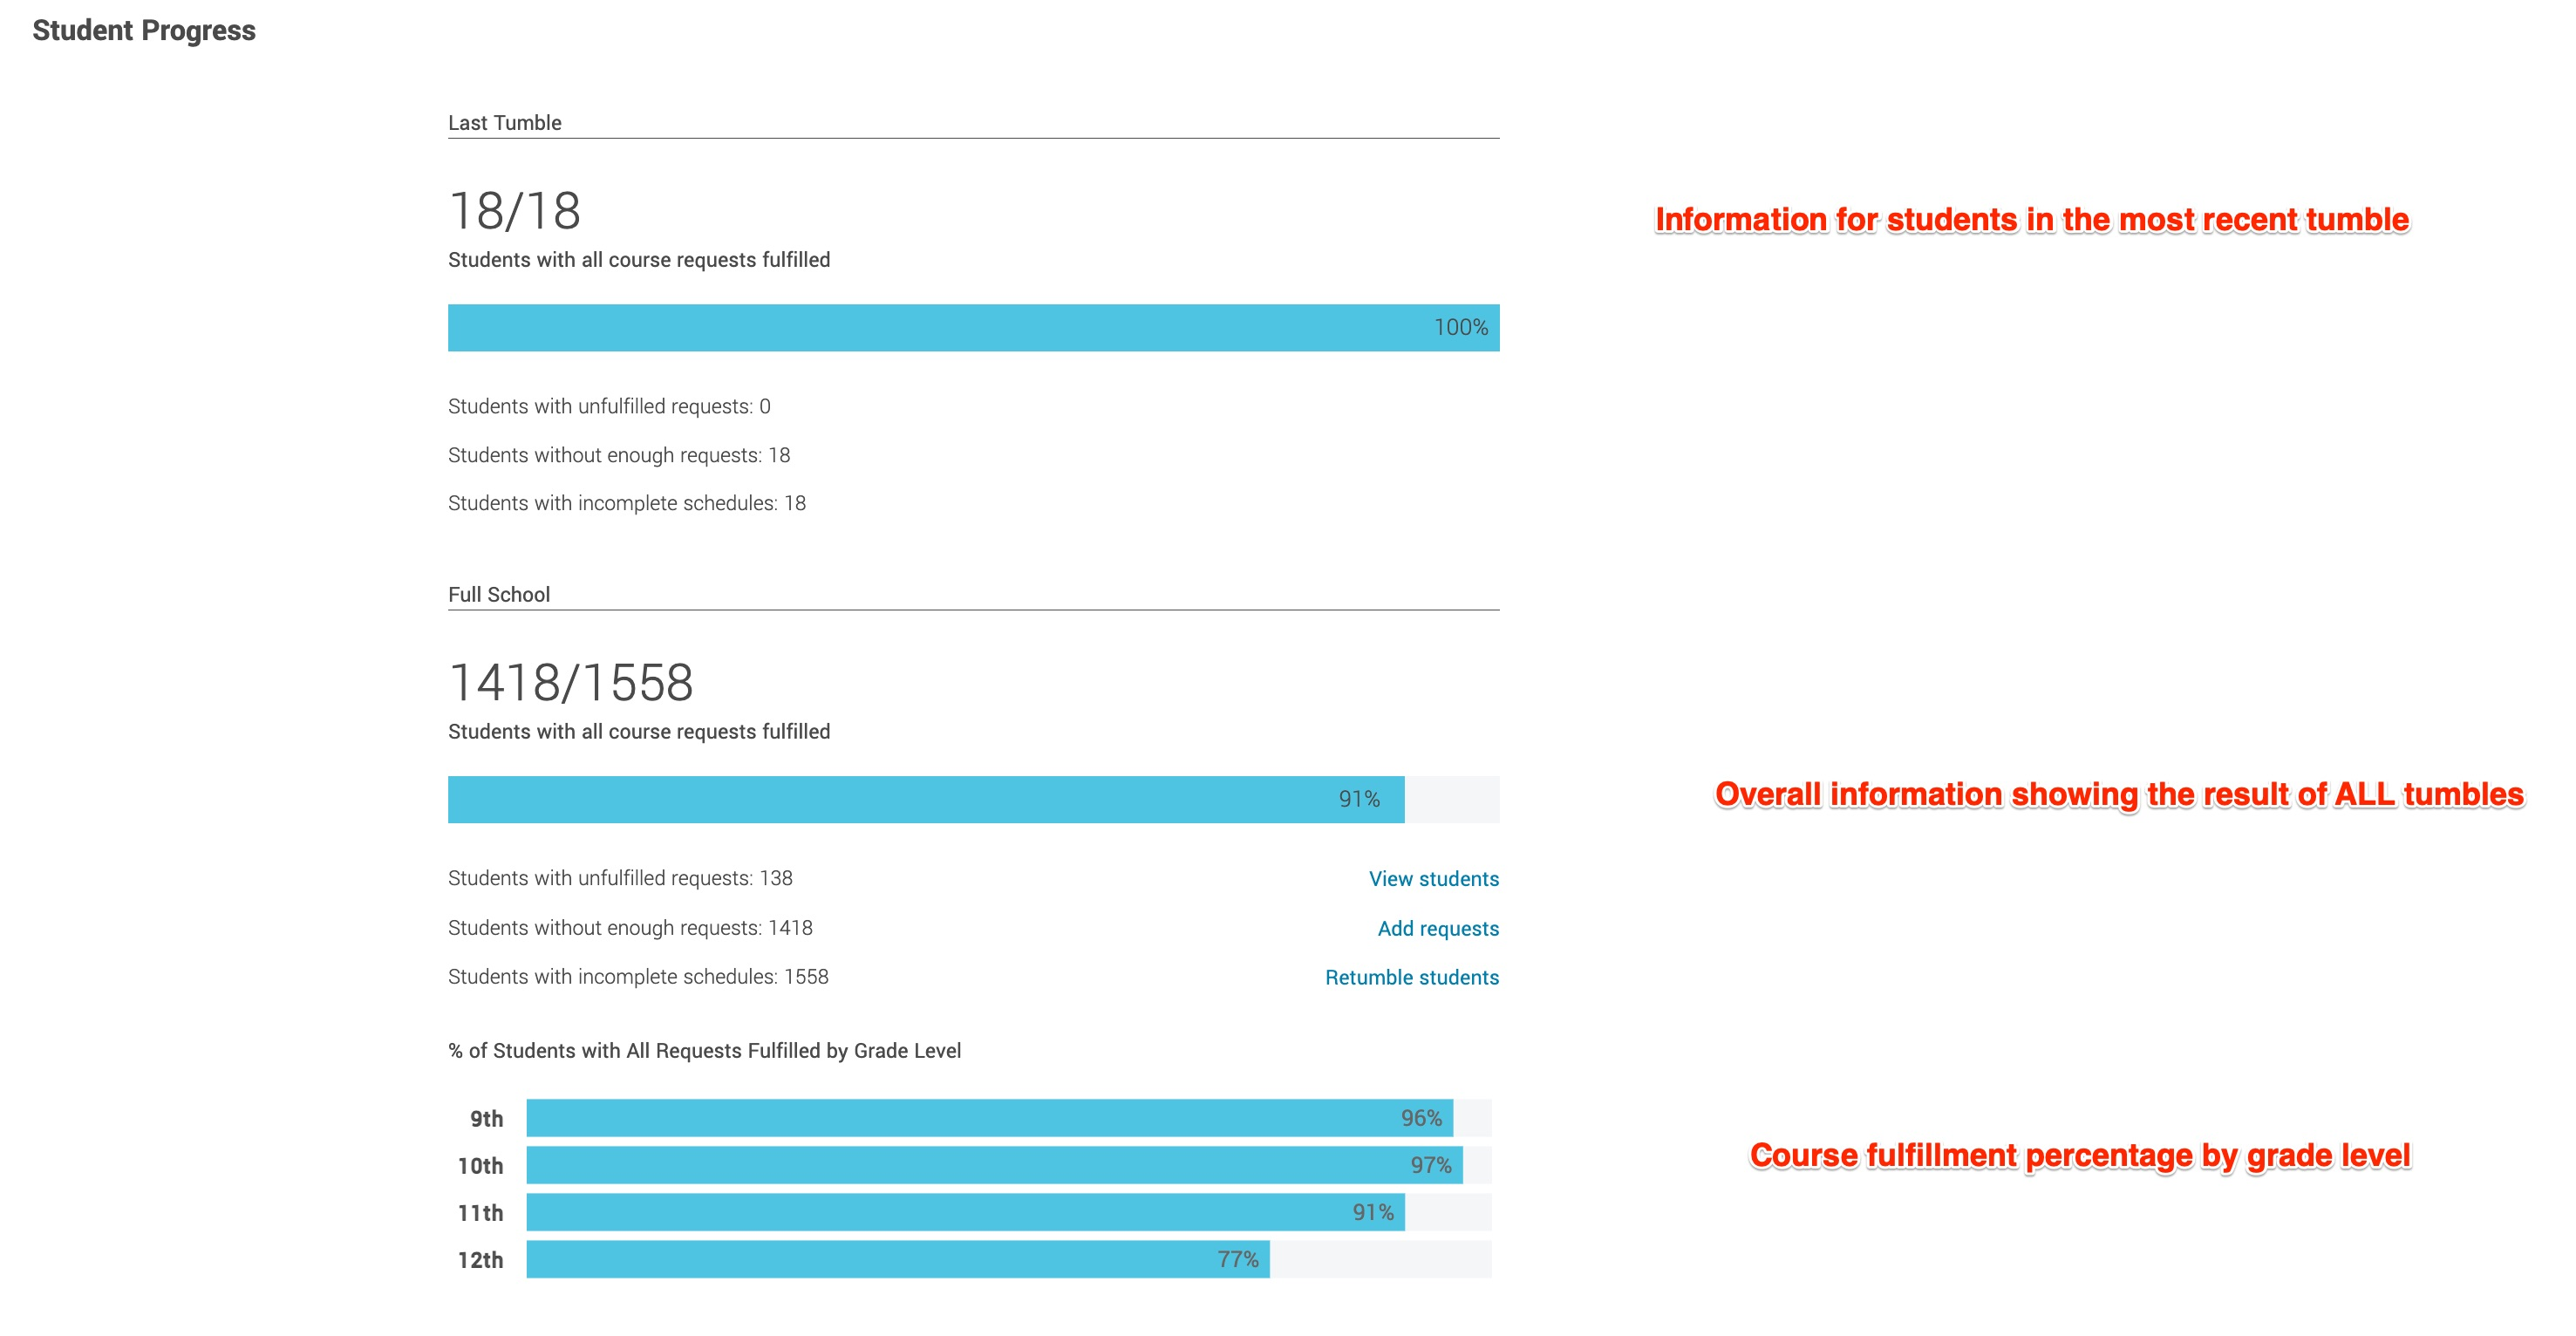
Student Progress
The student progress section will show information about the Last Tumble as well as progress for the Full School. Being able to compare these two is especially helpful as you layer in sections and student enrollments as you build your schedule.
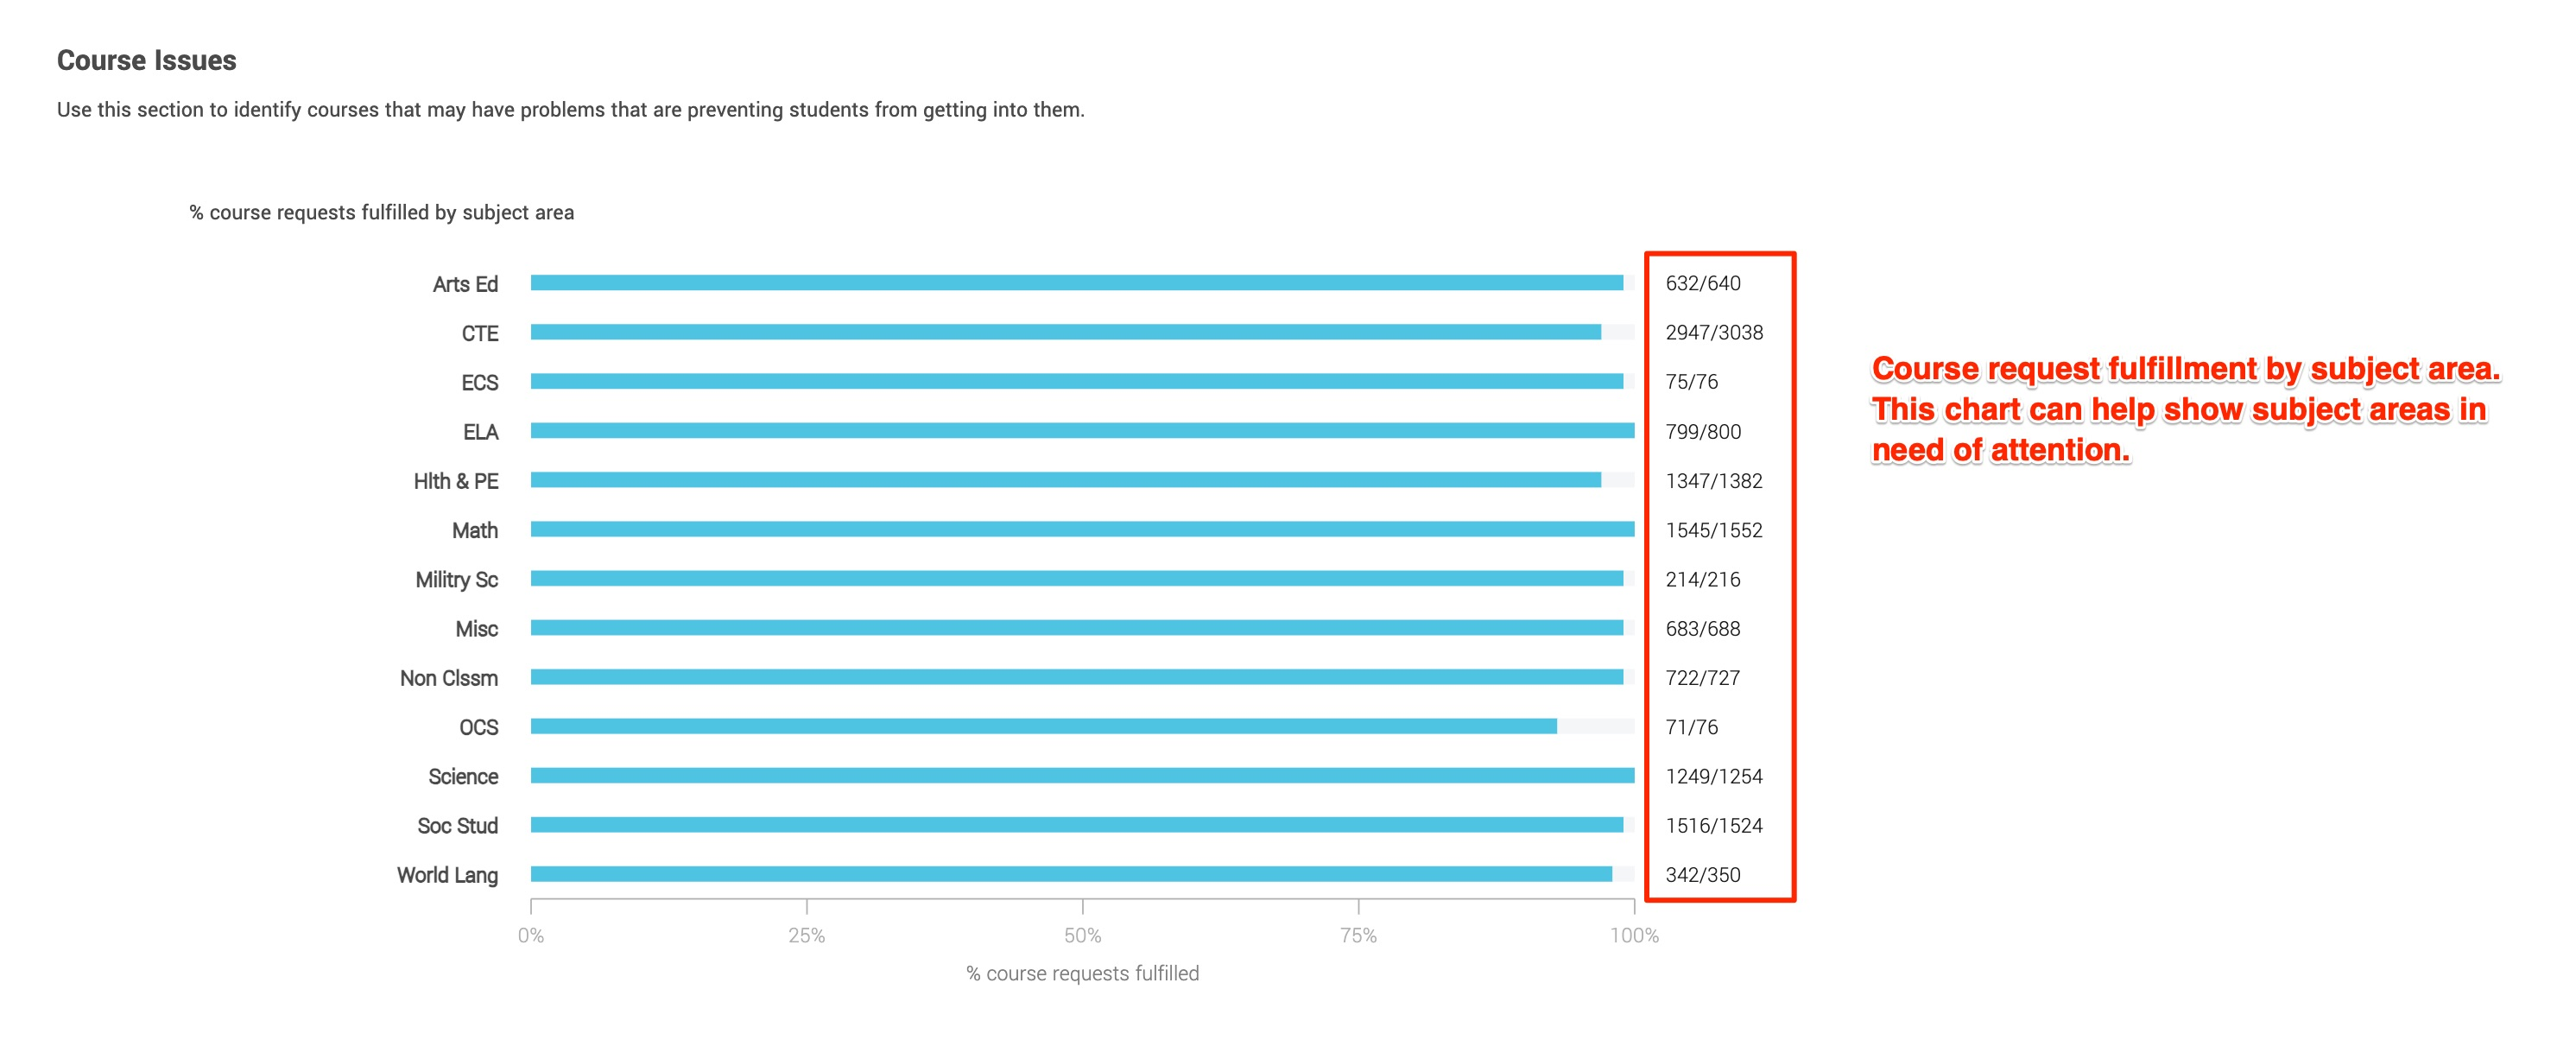
Course Issues
This section identifies courses that may have problems that pare preventing students from getting into them.
% Course Requests Fulfilled by Subject Area shows how close you are to satisfying all requests for students by subject area
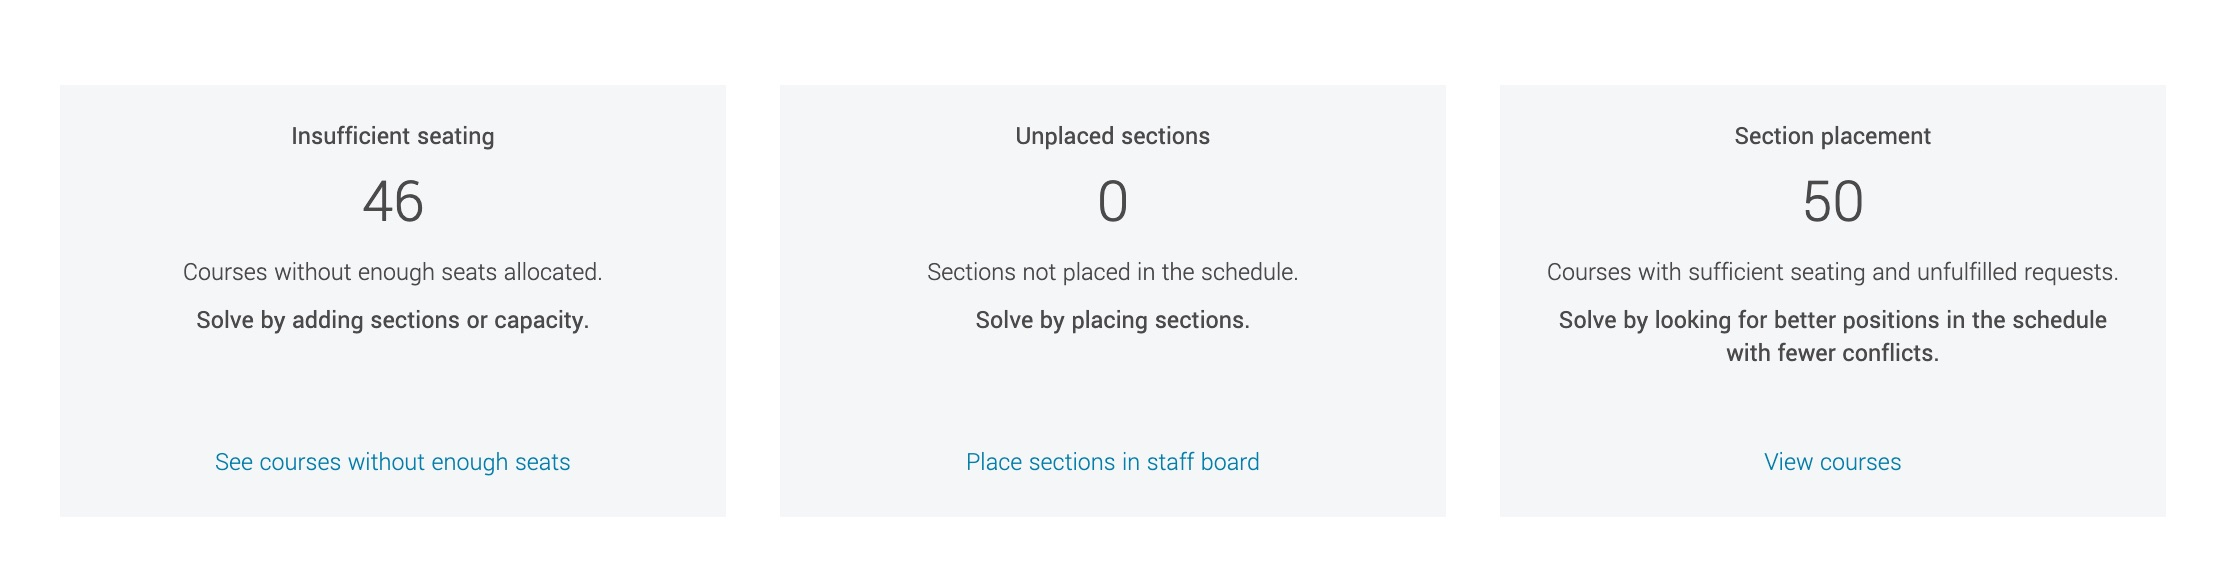
Insufficient Seating identifies how many courses don't have enough seats
Unplaced Sections shows how many sections still need to be placed on the staff board
Section Placement highlights courses that have adequate seating but students are unable to access the course due to other conflicts
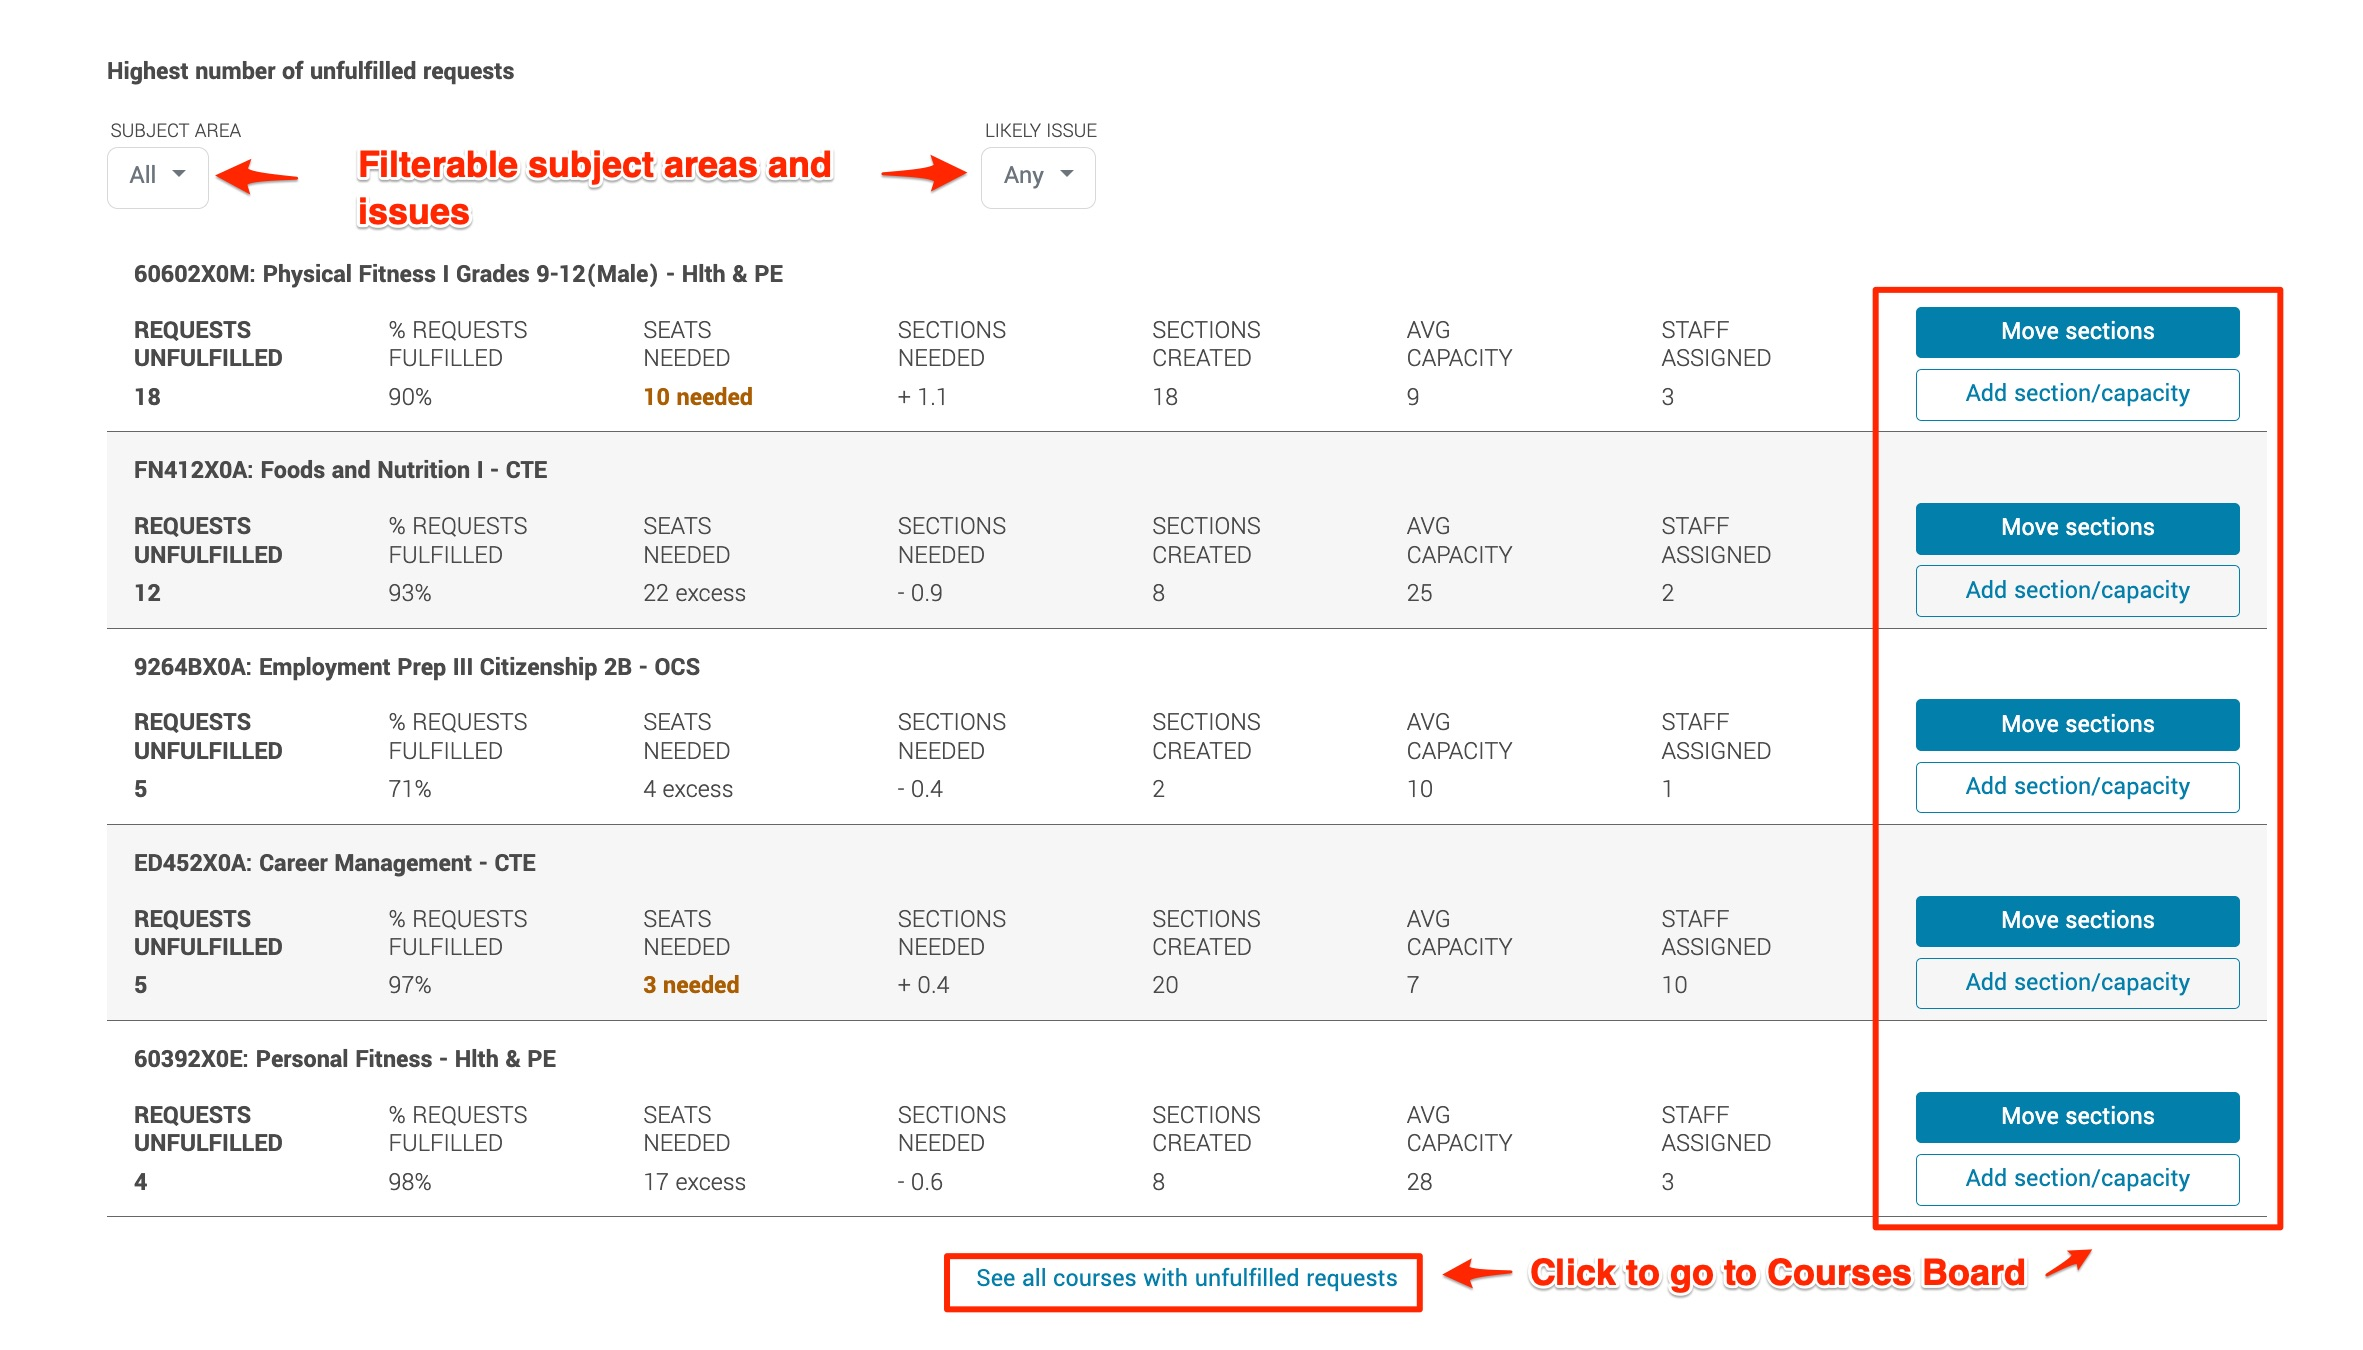
Highest Number of Unfulfilled Requests shows by course how many requests aren't fulfilled - look for any courses where where a high number of course requests were not fulfilled. This suggests that this section is not optimally placed. Note the course(s) for which you hope to improve results - we will use these later in the process.
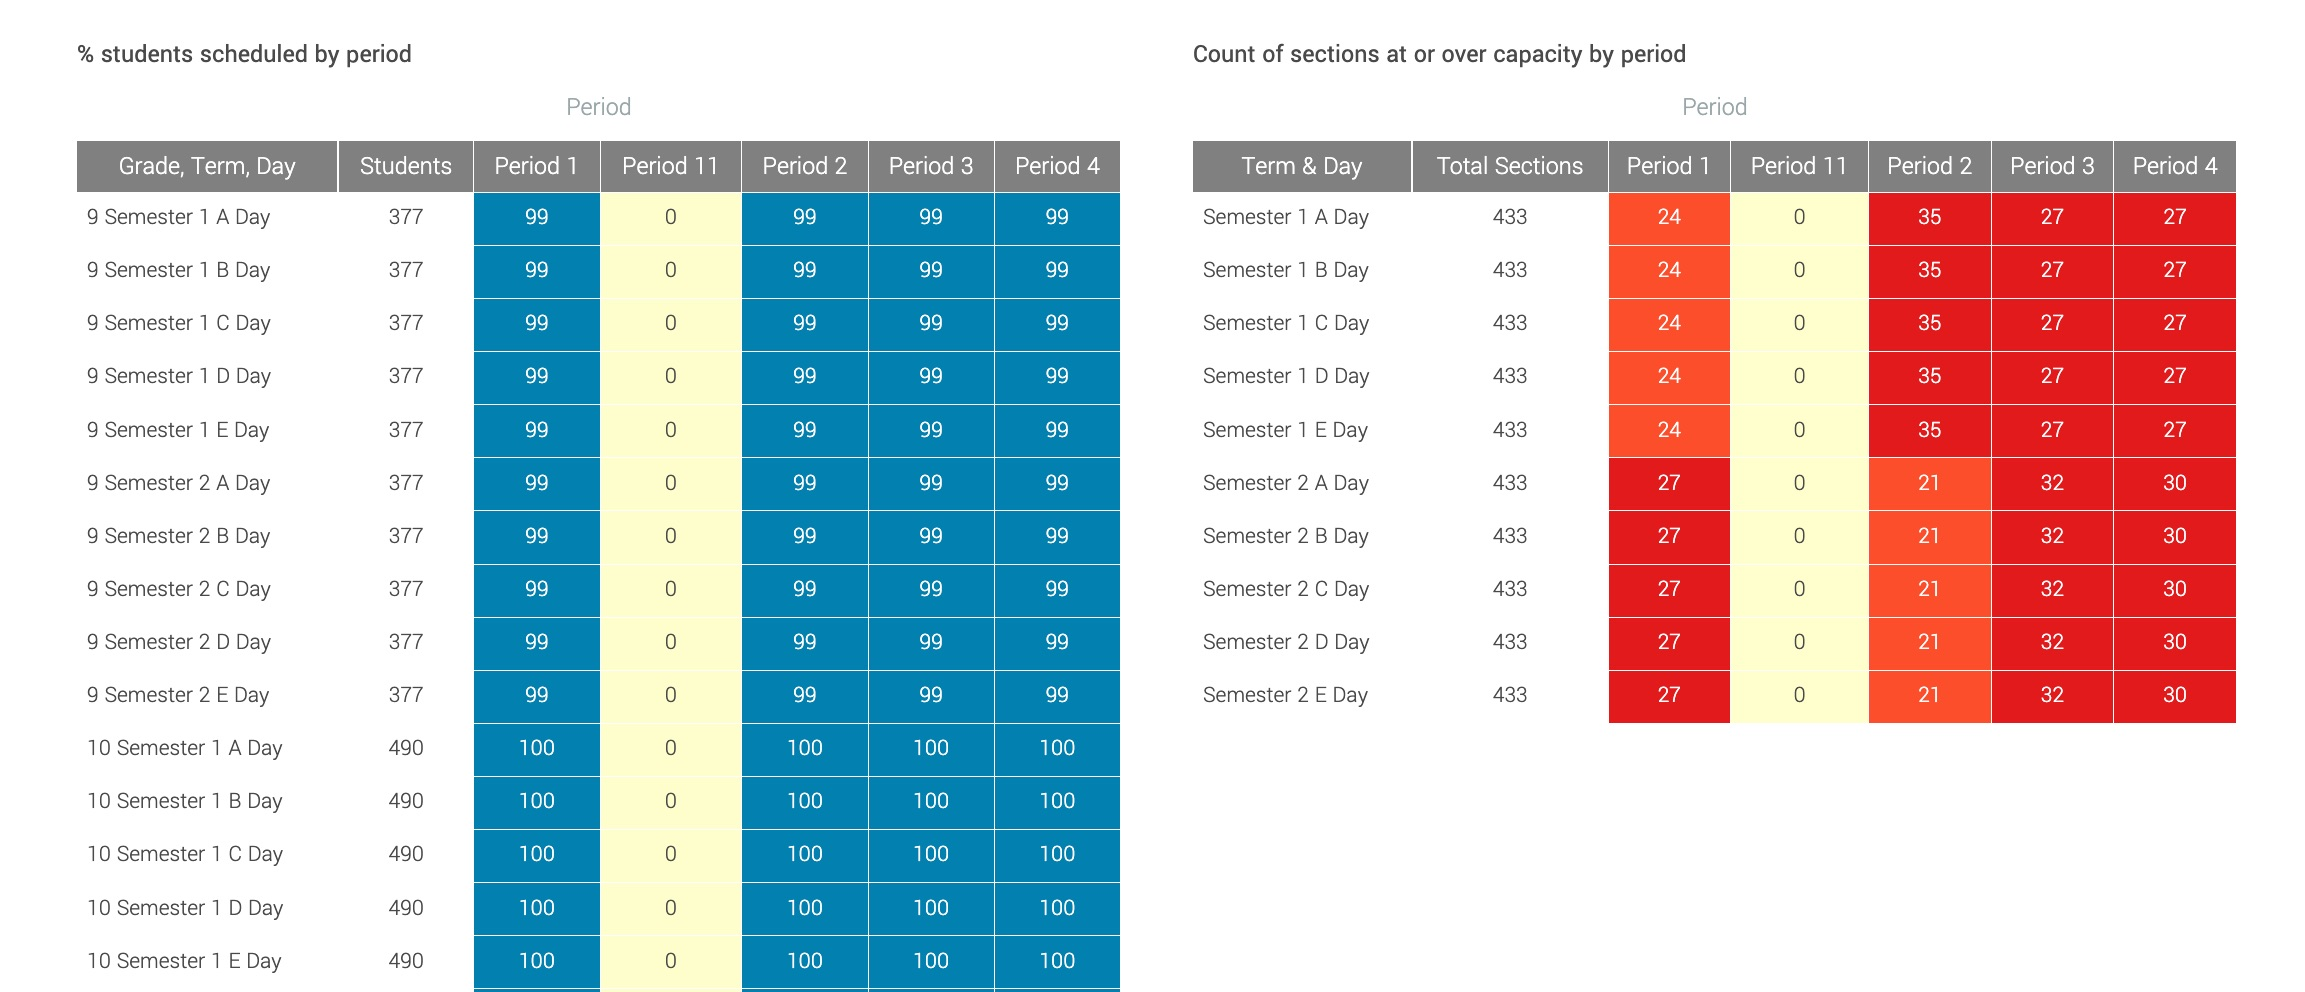
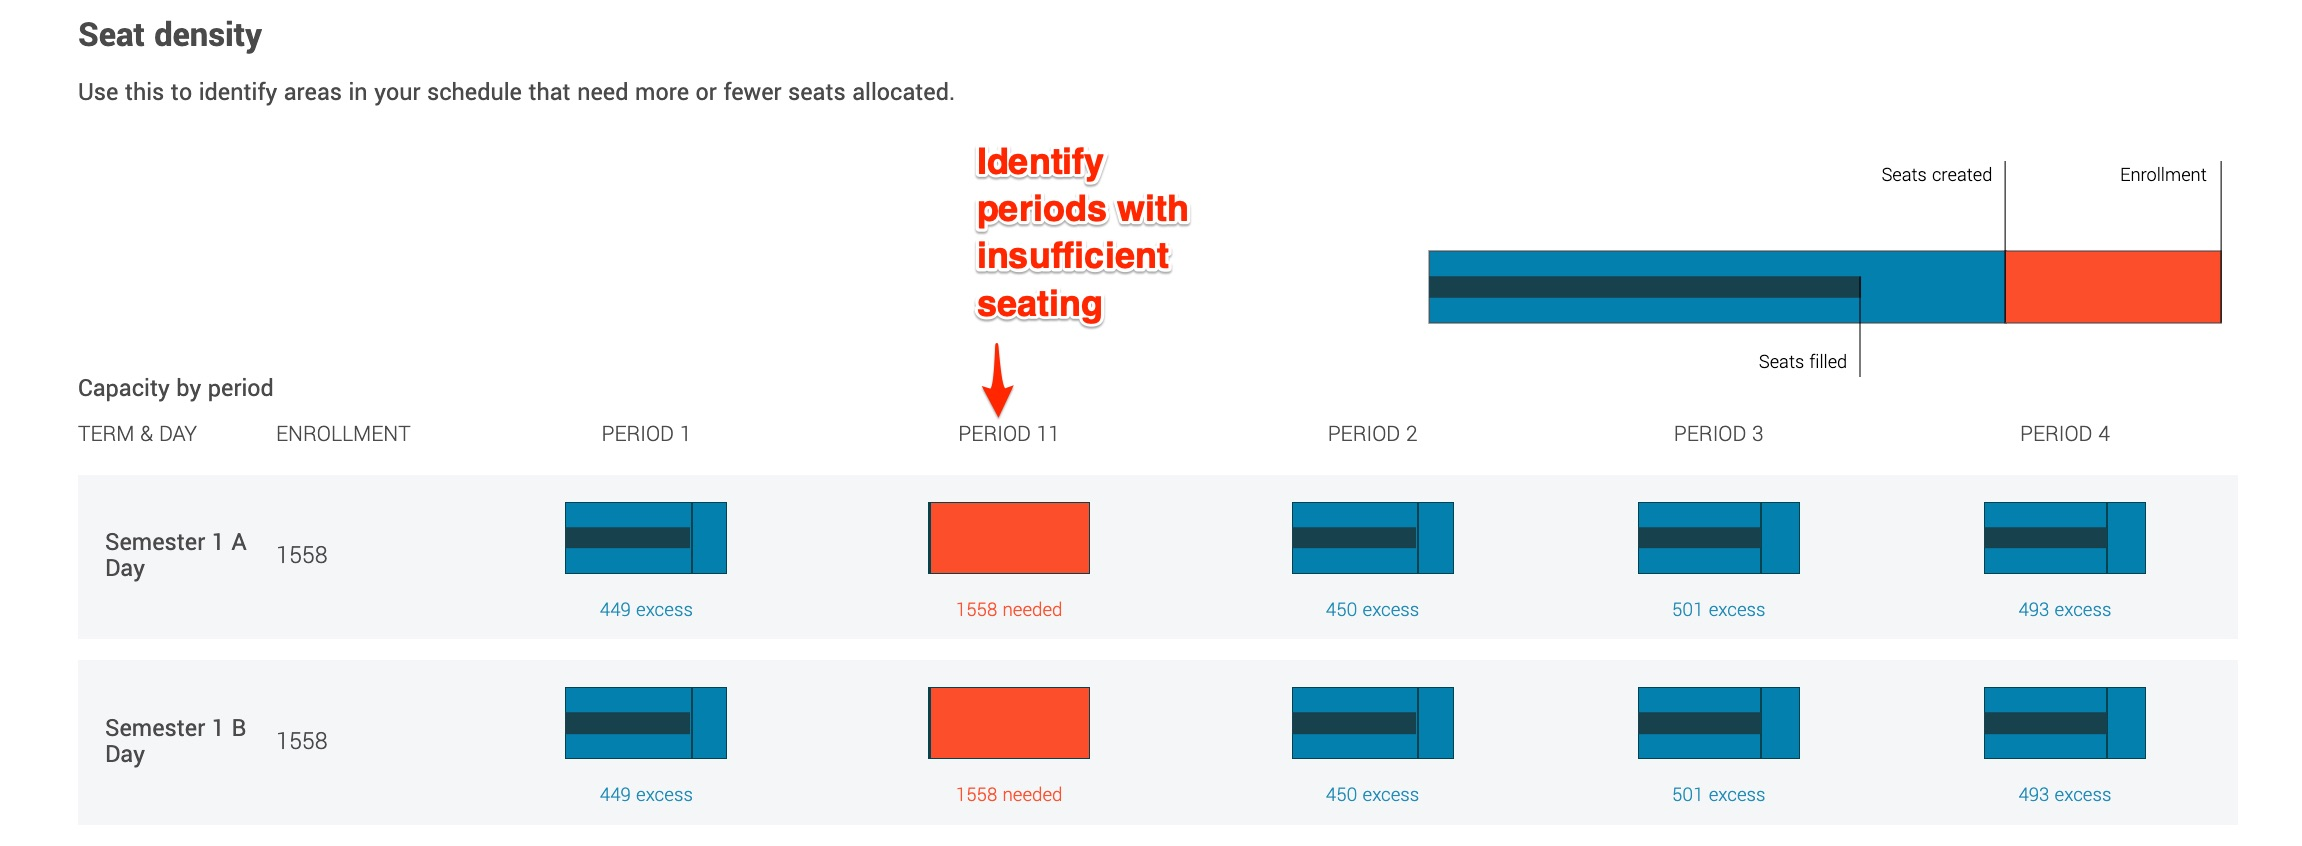
Seat Density
These charts illustrate the distribution of enrollments across sections and periods and highlights where capacity needs to be added or reduced.
Capacity By Period shows the school's total enrollment (in red), with how many seats have been created per period (light blue), and how many students have been enrolled per period (dark blue) - this is helpful to see overall the trends related to the schedule for all students
% Students Scheduled by Period shows how many students broken down by grade level have been scheduled by period - this is helpful to identify where a specific grade level may need more sections added
Count of Sections At or Over Capacity by Period shows what periods have sections that are at or exceeding total capacity - this is helpful to identify where more sections could be added to ease congestion in the schedule