Using Course Board List View
Course Board List View contains a wealth of data to help schedulers plan and execute a highly effective master schedule. The information on the board will update in real time as the schedule develops. Schedulers can use the sortable lists to find actionable data to help flesh out the schedule. A description of the data contained in the List View is found below.
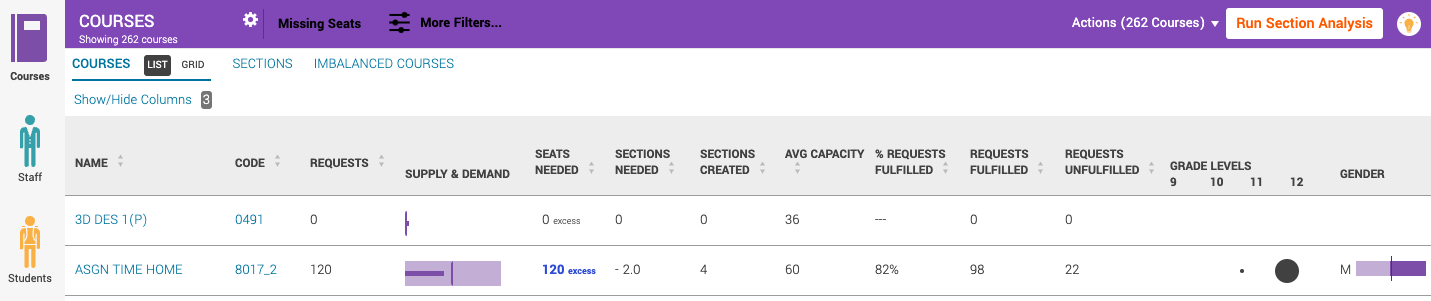
Requests: This column displays the total number of student course requests for the listed course.
Supply & Demand: This column uses a bullet graph to depict the difference between seats needed and seats created.
Seats Needed: This column displays the number of seats needed to fulfill all student course requests. Blue text indicates that there are more than a full section's worth of excess seats for a particular course, suggesting that sections should be eliminated. Orange text indicates that there are more than a section's worth of unfulfilled requests for a course, suggesting that additional sections should be created.
Sections Needed: This column divides the number of seats needed by section capacity to show the scheduler how many sections are needed/can be deleted.
Sections Created: This column shows how many sections of a particular course are currently created in Abl.
% Requests Fulfilled: This column shows what percentage of course requests for a particular course have been fulfilled (i.e. a student requesting the course has been enrolled in a section of the course).
Requests Fulfilled: This column shows the number of student course requests for a particular course have been fulfilled.
Requests Unfulfilled: This column shows the number of student course requests for a particular course have not been fulfilled.
Grade Levels: This infographic displays which students are requesting a particular course. A dot indicates that requests exist from that grade level. The size of the dot provides a relative idea of how many course requests come from a particular grade level.
Gender: This infographic displays the gender spread for course requests of a particular course.